Difficulty
Moderate
Steps
18
Time Required
168:00:00

In Progress
This guide is currently being written. Reload periodically to see the latest changes.

User-Contributed Guide
This guide is not managed by the site's staff.
Quiz
0
-
-
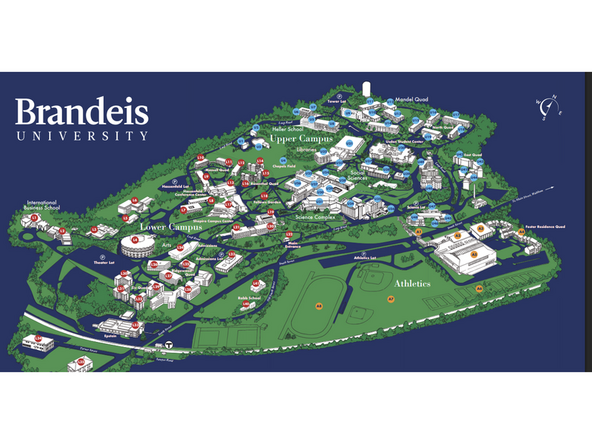
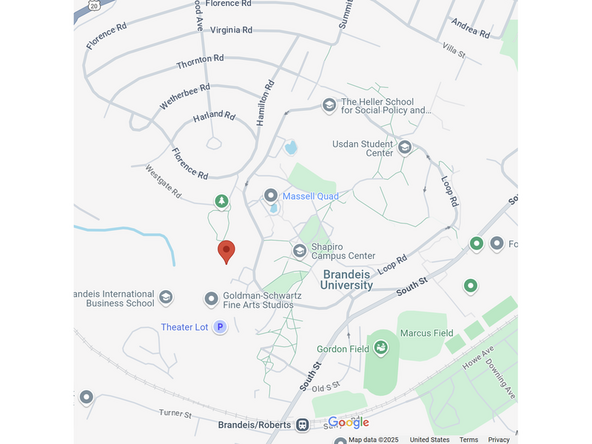
Using a map tool such as Google Maps, find an approximate address for the area you want to map
-
In our case, we chose to map Brandeis University
-
-
-
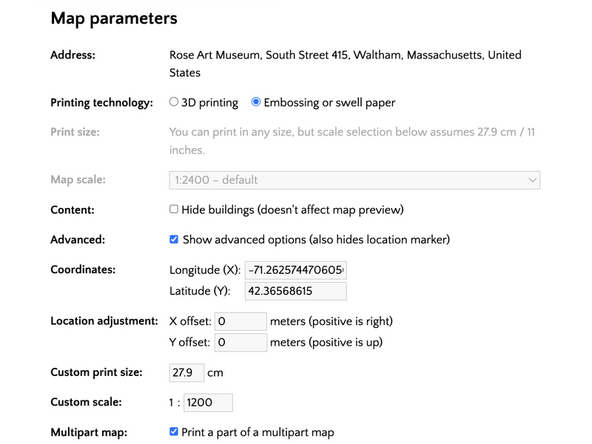
Upload the address to TouchMapper
-
Be sure the address format includes: Street Address, City, State/Territory (i.e. 415 South Street, Waltham, MA)
-
Once the address is uploaded, adjust the scale and location of the area you want to print
-
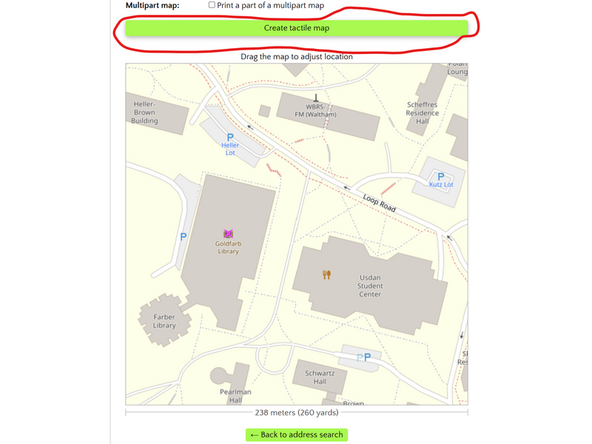
Although you can drag around a limited area at first, we strongly recommend checking the "Show advanced options" box, as that allows for easier navigation of the area you want to print, as you can use the 10% and 100% buttons to cover your entire surface without getting overlapping parts.
-
When you have the map of what you want to print, click on the green Create tactile map button
-
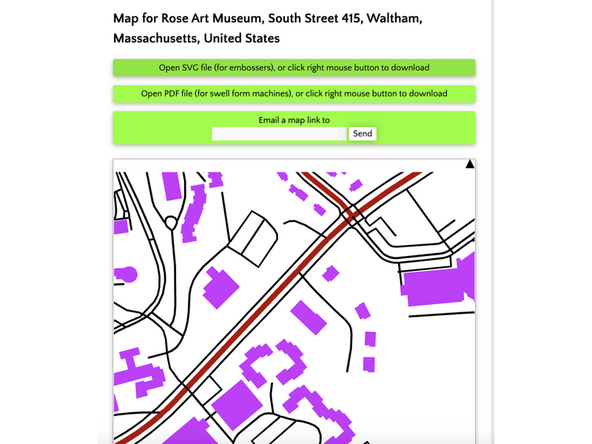
Once the map is generated, click on the green Downloadable printable SVG file and save it to your computer. If you do not see this option, make sure you have selected in settings for printing technology: embossing or swell paper and NOT 3D printing
-
-
-
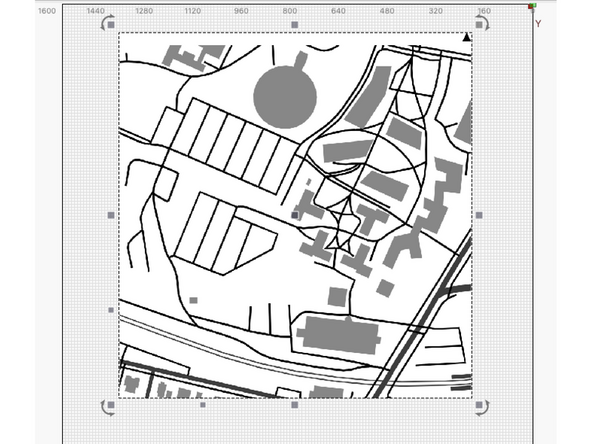
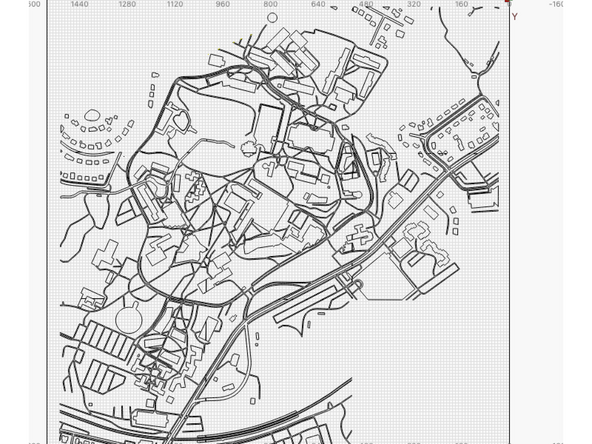
Once you have saved your files, convert your SVG to a JPG (using CloudConvert). This will allow for you to get ditinguishable lines (alternatively you can open up the SVG file on LightBurn, however it will be in triangles which will eventually need more editing)
-
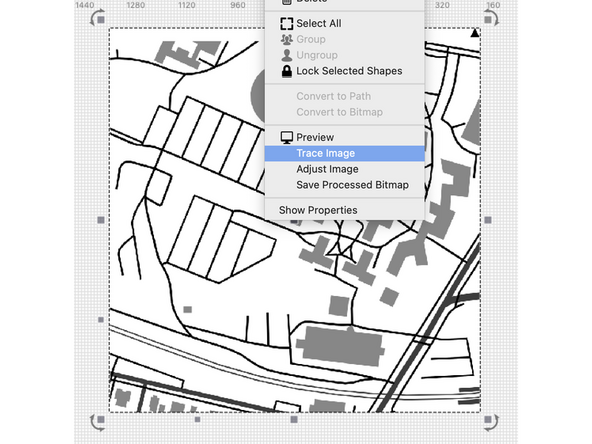
Once you add your image on LightBurn, right click and click "Trace Image". Adjust the Threshold in LightBurn until there is a pink outline around all the structures
-
Repeat this with as many images as you have to encompass your graph parameter and line them all up
-
-
-
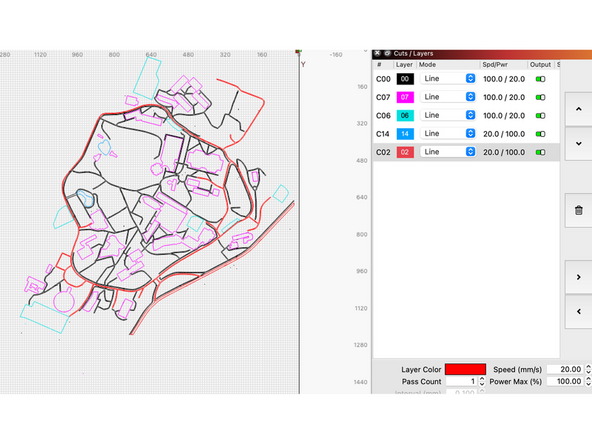
Once everything is lined up, ungroup the objects and remove any buildings that may not be relevant
-
Then, on LightBurn change the outline of buildings, roads, water and pathways each to distinct colors. This will allow you to choose which features you want to cut all the way through and which to just have an outline for. For the purpose of our map, we cut out pathways and water and outlines academic buildings
-
Edit the laser cutting speed and power for each corresponding color depending on which you want cut through and which to keep.
-
Depending on the limits of your laser printer, you may then need to section out your map to different pieces to then later put together. Once completed your ready to laser print!
-
-
-
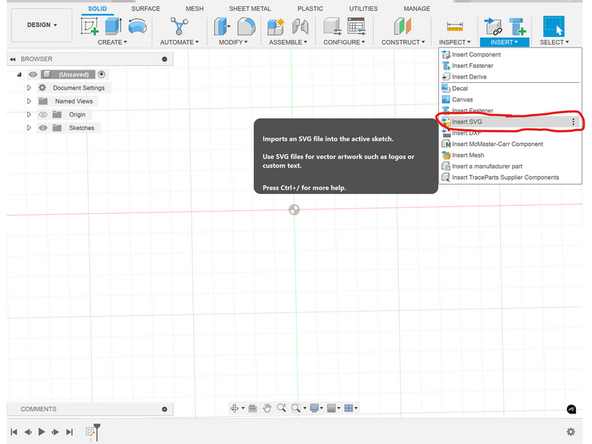
In LightBurn, export the SVG with only buildings, and import it in Fusion 360.
-
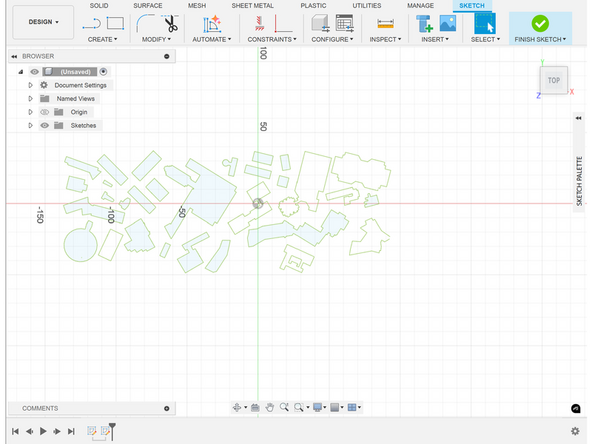
To import SVGs in Fusion360, hover over the insert dropdown in any tab, then click on the InsertSVG button, then upload your SVG. Center the SVG and press "Finish Sketch" in the top right corner
-
Once your SVG is uploaded, check if all of the buildings have a light blue infill.
-
If not, trace new sketches over the outlines with no infill by using the create sketch tool (we recommend tracing over using a line sketch).
-
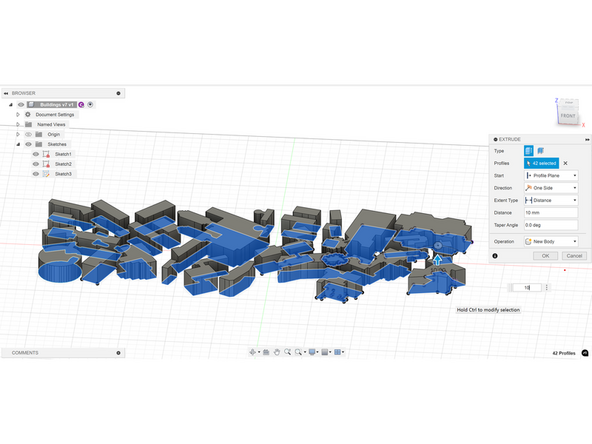
Once all the buildings have a light blue infill, be sure to press Finish Sketch in the top-right corner, then select all of the buildings by making a group selection using the select tool in the top-right corner, or crtl (command on Mac) + left click on each of the buildings
-
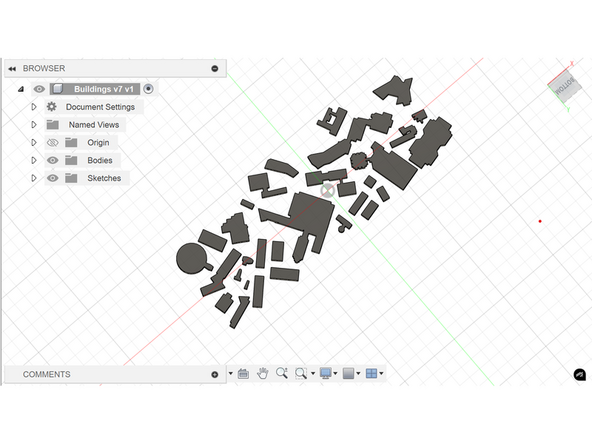
Click on the extrude button (the blue square with the upward arrow in the top-left corner next to start extruding. Enter your desired height (we recommend 10mm), then press enter. Your buildings should be solids, like in the third image.
-
-
-
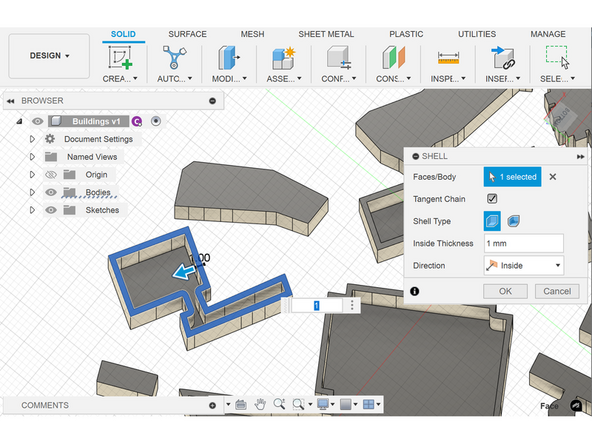
For the sake of printing time, we strongly recommend shelling your buildings before continuing.
-
To do this, view your buildings from the bottom, then right click the bottom layer of the building you want to shell, then press the shell button from the dropdown menu, and enter your desired inside thickness. Be sure the direction is set to inside.
-
This step may require some trial and error, but if you followed along with this tutorial, we recommend an inside thickness between 0.5mm and 1mm for each building. Smaller buildings require smaller inside thicknesses.
-
Repeat this step for each building.
-
-
-
Once you have your buildings extruded and a list of what number matches each building, it's time to add numbers to each building
-
To do this, press create sketch, then select the top layer of the building you would like to add a number on.
-
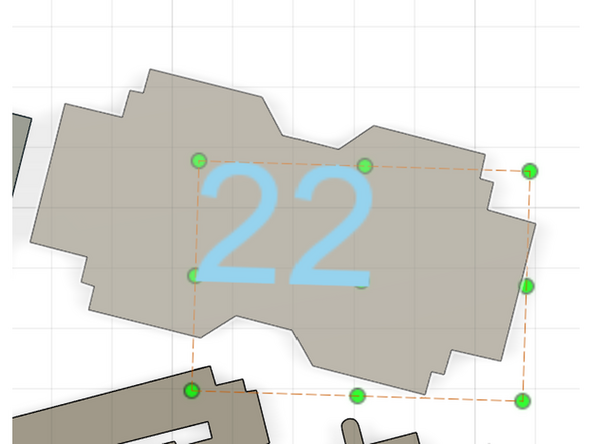
In the create dropdown, press text, then select a small area, then type in the corresponding number.
-
Adjust the size and position of the text if needed
-
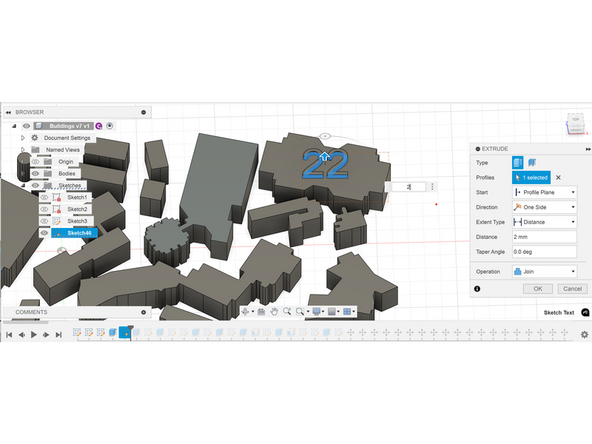
Once you have your number in a good position, press Finish Sketch, then click on the number, then press the Extrude button, and extrude it a short distance (we recommend 2mm)
-
Press Finish Sketch, and repeat these steps until all necessary buildings have extruded numbers on them
-
-
-
Once all of your buildings are shelled and have their respective numbers on top, export your Fusion360 file as an STL file.
-
Import the STL file into PrusaSlicer
-
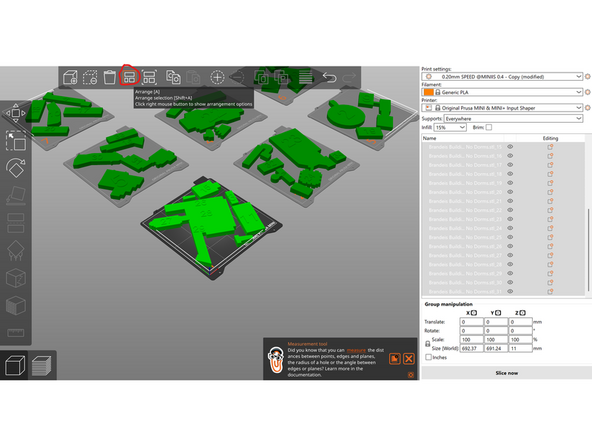
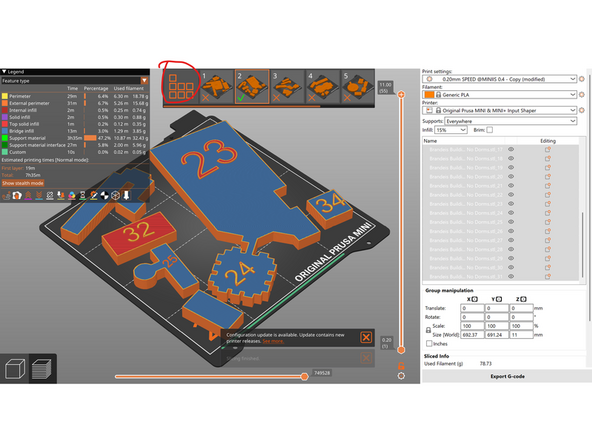
Ungroup your buildings by clicking on any building, then pressing the Split to Objects button, as circled in red.
-
Scale the buildings in PrusaSlicer so that they match the desired cut-out scale from your laser-cut map.
-
To do this, choose a building on the map that has an easy length or width to measure with a ruler or digital caliper.
-
Select the building you are scaling in Fusion 360, check its associated length or width respectively, to what you just measured, then divide the newly measured length or width by the original length or width.
-
Multiply that new value by 100, then unlock the lock in Object Manipulation by clicking on it. Select all buildings again (Ctrl/Command + A), then enter the newest value into the scale boxes for the X and Y values (not Z, that should be around 11mm). If you followed along with this tutorial, the scale should be around 375.86mm.
-
With all of the newly scaled buildings selected and split into objects, arrange all of the buildings by pressing the Arrange button in the top menu.
-
-
-
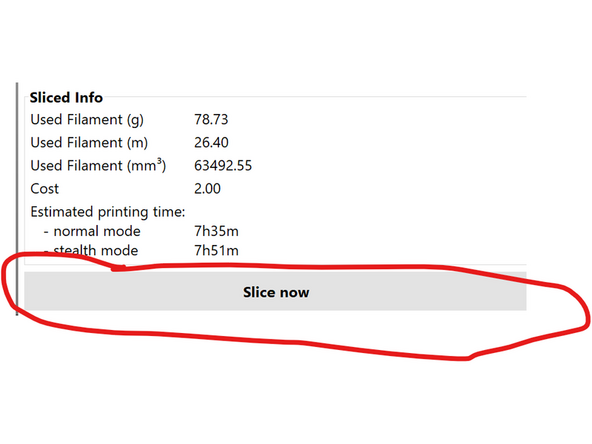
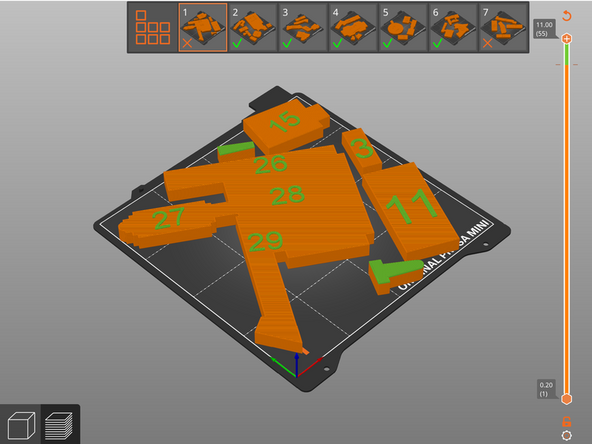
Once all your buildings are scaled and arranged, slice all your buildings by pressing the Slice Now button in the bottom-right corner.
-
This will only slice one tray, however. To slice all of them at once, in the tray-switch menu, press the button with seven squares to slice every tray at once.
-
If you notice one or more objects are too big for a tray, adjust the size of that building and then rearrange all your buildings using the arrange tool.
-
Once all buildings are sliced, calculate where to add a layer change by calculating the original building height (without including the number) plus 0.2mm.
-
For example, this tutorial would use a filament change at 10mm + 0.2mm = 10.2mm
-
To incorporate the filament change, after slicing, drag the + icon on the top of the filament bar down to your desired changing height, then click on the + icon, then drag it back to the top.
-
Repeat for each tray, then slice all of the trays again.
-
-
-
Once you have your buildings sliced with a filament change instruction, select the tray you want to print, and then export the G-Code to a flash drive.
-
Plug in the flash drive to a 3D printer, and begin your print.
-
IMPORTANT: For the filament change, we strongly recommend using a contrasting color from the initial color you chose to print. For example, if you choose to print your buildings blue, we recommend changing the filament to a color like orange when it's time for the filament change.
-
Repeat this step for each tray
-
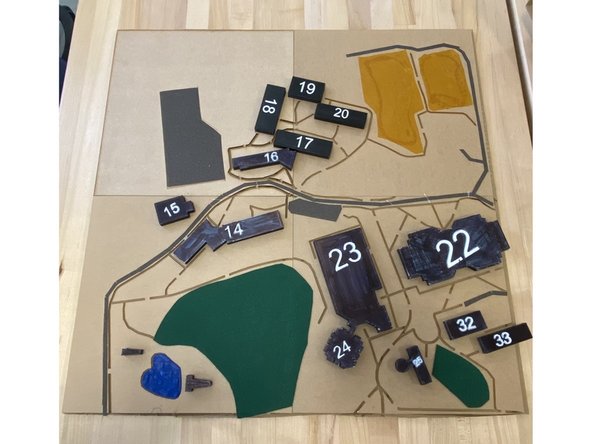
Once all the buildings are printed, arrange them on your laser-cut map and superglue them down.
-
-
-
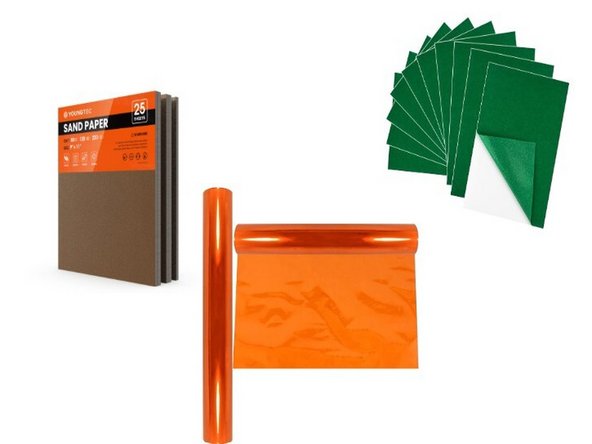
First identify categories of map features that you need to differentiate between. For our map this included: walking paths, pavement/roads, academic buildings, water, grass, and residential areas
-
When selecting your textures, it is important to make sure that they “make sense” for what they are going to represent. For example, we chose to use sandpaper for pavement and felt for grass.
-
-
-
Testing period: get a group of at least 5 people to feel your textures and give you feedback on them
-
Create a “testing strip” containing a small sample of each texture
-
If your test subjects are not visually impaired, make sure they close their eyes or obstruct their vision in some way when using the testing strip
-
If you have multiple options for textures representing the same map feature, have people let you know which one works best! For us, we had people differentiate between 3 different sandpaper grits and they liked the intermediate option best
-
Make sure that the textures for each map feature is mostly intuitive - if people have a hard time differentiating between them or knowing what they represent, consider using other textures
-
-
-
It’s important to make sure that there is color contrast between each of the textures! Not all visually impaired people are blind - in fact most are low vision, so color contrast is extremely important
-
Again, it is preferable that you select color contrasts that make sense for what the textures are representing. For example, we used bright blue PLA plastic for our water, green felt for our grass, and black sandpaper for our pavement/roads.
-
To represent residential areas we used bright orange cellophane because it contrasted with the existing textures in both a visual and textural sense
-
-
-
Cut out each texture to appropriately match the shape of what it is representing on your map
-
Adhere the textures onto your map using wood glue
-
For certain features such as water, you may have chosen to laser cut out the space completely, rather than adhere the texture on top of the wood/acrylic base. In this case “pop in” the texture into the hole representing the feature. For us, we “popped in” a 3D printed texture representing Massell pond into our map
-
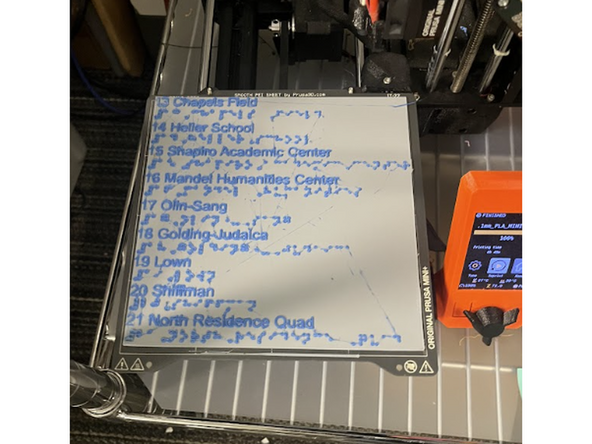
Create a texture legend for your map* Include small, square cutouts of each texture, accompanied by labeling in Braille (as discussed how to produce in the “Labeling the Map” section of our guide
-
*We did not get to completing this step on our map, but it is an important and necessary component in our future plans!
-
-
-
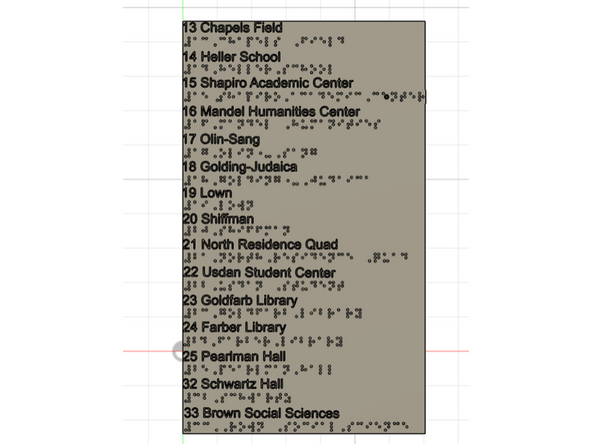
Discern What to Label: We needed to understand what was most important to include. In this case, academic buildings and student services were most important. This allowed us to reduce our labeling. We combined residence quads and multi-named/ connected buildings.
-
Order the Legend: The visual map legend was complicated to follow, so we kept ours more straightforward with a numerical ordering rather than alphabetical. However, we did follow the flow numbering on the map.
-
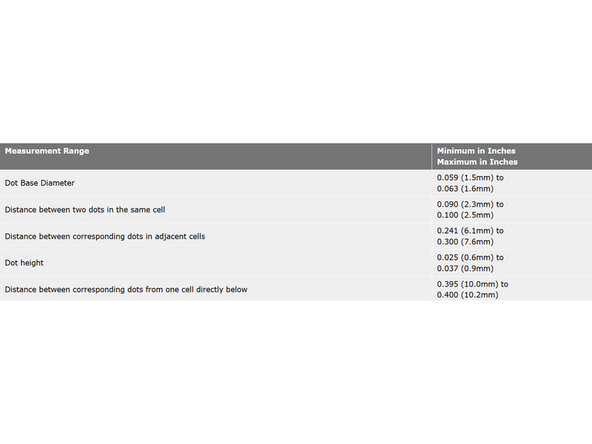
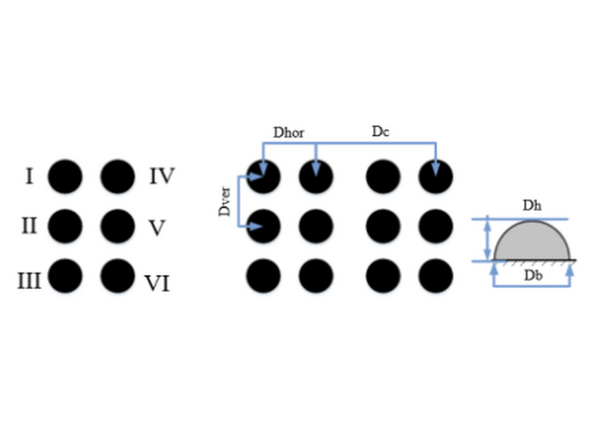
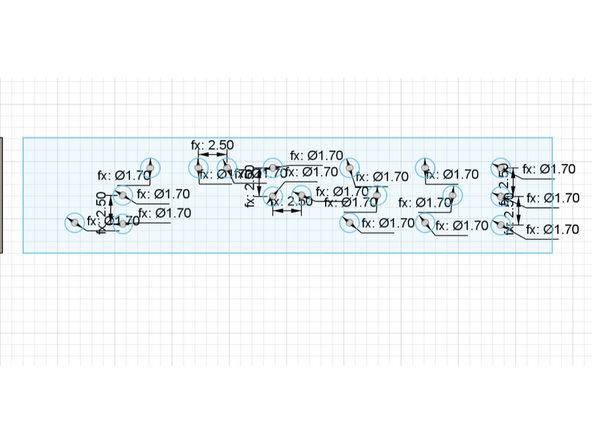
Braille and Large Text Standards: We used the North American Braille Authority’s sizing and spacing guidelines. Our braille had a dot height of 0.9mm, a dot diameter of 1.7mm, interdot spacing of 2.5mm, and adjacent cell spacing of 6.1mm. There are also large text guidelines, we used a 20 pt font on the legend.
-
-
-
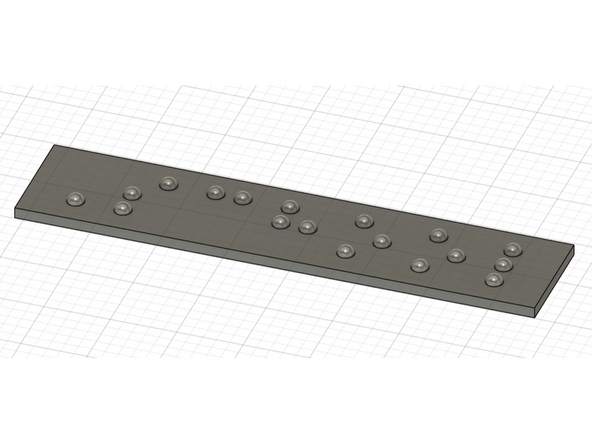
CAD Braille: 3D printing was the most accessible option for us. Braille translator was an important resource for providing accurate labeling. With some digging, we found a braille plug-in feature of Fusion 360 that was easily downloaded and usable. Printing this without editing comes out small and undefined.
-
We found a comprehensive guide and tutorial on Instructables that worked with the Fusion 360 plug-in. This guide was invaluable in creating polished parameterized braille with Fusion 360 https://www.instructables.com/Easy-3D-Pr....
-
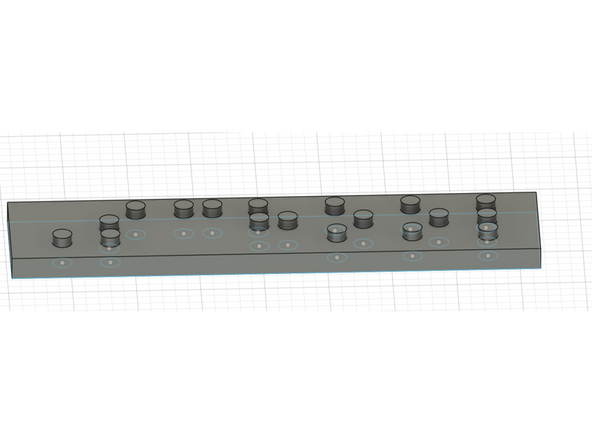
First, the plug-in generates a body of text. Then create a sketch on the same plane, and the projection tool is used. Edit using the dimension tool, taking advantage of user parameters in Fusion. Once the sketch is edited, it can be extruded (body 2mm, dot 2.9mm). Then, the fillet tool rounds the dots. We used .75mm with the rolling ball shape.
-
-
-
Even with reduced labeling there is a lot to edit. This can be a tedious process depending on the number of items, but looking for overlapping words and numbers and duplicating these speeds things up. Then with the braille pieces, line them up and combine the pieces together.
-
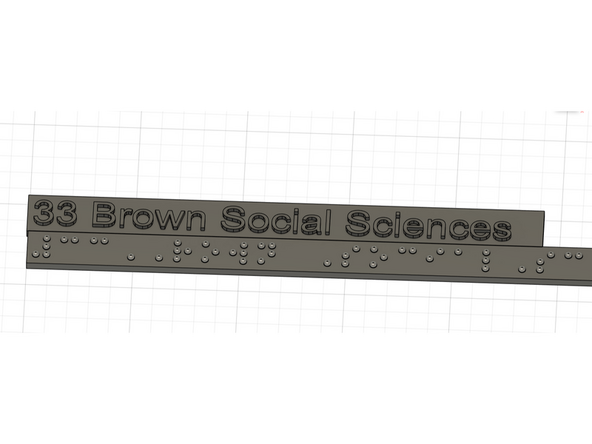
Adding text between the braille is much simpler. Fusion’s text function works well, and a pt to mm guide is widely available. We used a 20 pt font, which is 7 mm in height.
-
Then, the text and braille lines can be arranged and combined into a legend.
-
Lastly, this can be sliced and a pause for a color change where the dots and letters are raised is added. Then, the legend can be printed, and a sanding tool can clean up the dots.
-